
Hello Traders!
Welcome back for this week’s FX Weekly Analysis…
I’ll be going back to basics for trend analysis, e.g. spotting high’s and low’s to determine directionality. As you’ll recall:
- Higher highs + higher lows = uptrend
- Lower highs + lower lows = downtrend
Monthly Chart
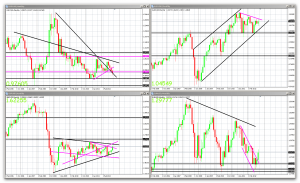
Weekly Chart
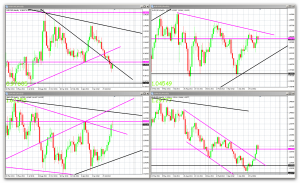
Daily Chart
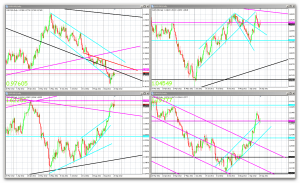
H4 Chart
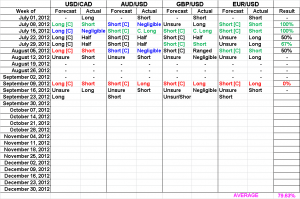
Commentary / Technical Forecasts
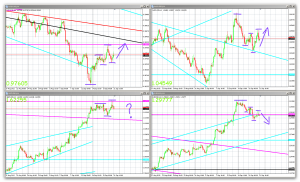
As per the introduction, all the high’s and low’s will be drawn on the H4 chart from now on to indicate the directionality from a technical stand point.
Another note, compared to last week’s charts. I removed all the red (H4) lines but everything else was kept just to show that sometimes longer timeframe lines are respected. USD/CAD and GBP/USD both bounced down off of the weekly resistance level while AUD/USD bounced up from the daily downward trend line. However, EUR/USD didn’t bounce according to what I had drawn but that’s ok, the example still holds.
USD/CAD [Long]: From a technical standpoint, USD/CAD was pretty low last week and it’s been going down for a while now. So a retrace or a bounce was imminent but correctly pointing out the bounce point is not possible for anyone. That’s why last week I preferred to not forecast anything. Going forwards, given the higher high’s and higher low’s, this looks to be going up assuming it can break the resistance level. I would normally have a condition in play here but I scrapped those as of last week. Alternatively, the recent low was near the first low so this could possibly be ranging as well but I also stopped using those types of forecasts… Moving forwards, the resistance level has to break along with the monthly trend line for more upside momentum.
AUD/USD [Short]: This is the contradiction forecast this week. Given the higher high’s breaking the previous lower high’s and low’s, this might be continuing to move upwards. In combination with the bounce off of the daily trend line, an upward move might be supported. BUT I’m forecasting short due to other higher timeframe factors, refer to the daily chart to see what I’m talking about. I don’t have a line drawn for the double top but you can clearly see it from the end of July and the recent high. In addition, price almost hit the upward daily trend line for a resistance bounce down + the weekly downward trend line for another resistance bounce down. So, despite the shorter timeframe high’s and low’s indicating upward movement, higher timeframes look better for a drop down.
EUR/USD [Short]: Given the lower low’s and lower high’s, price is indicating some downward movement. However, it’s not unchallenged though. If you look at the daily chart, you can see the weekly support level. Thursday’s candle ended with a pinbar close at the level followed by Friday’s candle which was a doji close at the level as well. Using candle stick analysis, this would indicate a possible reversal point. This would be supported by trend analysis via pullbacks to previous levels before moving onwards. But seeing as how the support level was punctured twice, the bull’s are putting up a fight but looks like they’re running out of energy if bears keep closing it at the level. Maybe I should’ve forecasted unsure for this pair, but I like it going down.
GBP/USD [Unsure/Short]: Given the lack of higher/lower high’s and low’s, there’s no short term indication of direction. But if you take a look at the weekly chart, you’ll notice a doji candle which bounced off of the weekly resistance level. Doji’s placed in the correct position can indicate reversal in direction. So that’s why I have (half) a forecast for short, but the overall forecast is unsure since doji’s are only verified after the next candle has occurred.
Until next week, Good Luck Trading!
Brian