
Hello Traders!
Welcome back to another week of FX Analysis!
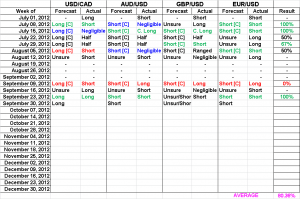
As you can see, last week as good. Hopefully “I’m back” in action for good from here on out!
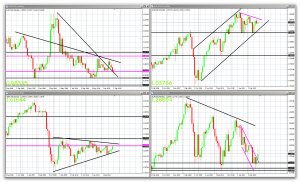
Monthly Chart
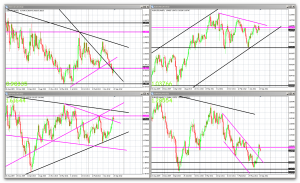
Weekly Chart
Daily Chart
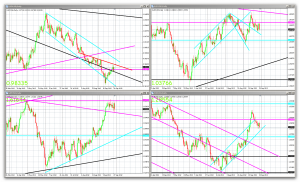
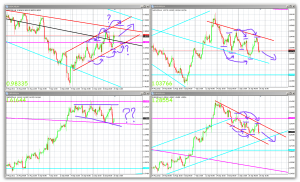
H4 Chart
Commentary / Technical Forecasts
As per last week’s FX Analysis, all the high’s and low’s will be drawn on the H4 chart to indicate the directionality from a technical stand point.
NOTE: Canadian and US employment data comes out next Friday, so don’t be surprised if Friday’s price action totally wipes out the forecasts (or helps them, which has never happened before, news rarely helped me in the past)…
USD/CAD [Long]: As you can see on the H4 chart, USD/CAD is currently in an upward channel. It broke the weekly resistance (magenta line) and the monthly downward trend line as well. So moving forwads, upward momentum looks like it’ll push USD/CAD up some more. In addition, if you take a look at the monthly chart, you’ll notice a doji/hammer. Depending on how Sunday closes the candle, that’s a pretty bullish sign for the weeks to come!
AUD/USD [Short]: Even though this was a contradiction forecast last week, correlation trading and higher timeframes prevailed! Moving forwards, this is currently in a downward channel so the forecast is down some more. In addition, (like USD/CAD) the monthly chart shows a doji/shooting star. Depending on how Sunday closes the candle, that’s a pretty bearish sign for the weeks to come! PS: the red H4 trend line was drawn as a parallel line from the aqua daily trend line, so the downward channel is drawn from previous levels not the newly formed levels.
EUR/USD [Short]: Last week’s support level after being punctured twice did not hold, and bears took price for a nose dive downwards. Short term price action prevailed despite the challenges of candle stick analysis of doji’s/pinbars. Currently, price is in a narrow downward channel and price action is poised to continue moving downwards. Obstacles that lie ahead is the daily upward trend line and the daily support level. Correlating with the other pairs, this should have enough momentum to break downwards unless news intervenes.
GBP/USD [Unsure/Short]: Given the lack of lower high’s, there’s no short term indication of direction. You can see the diverging triangle that I drew in purple on the H4 chart though. It has to break the magenta trend line first before it can drop. But looking at the weekly chart, I mentioned the doji last week preceding the possibility of a reversal coming soon. For last week’s forecast even though I was half right, I didn’t take the win, I just left it alone on the spreadsheet. Next week however, if GBP/USD continues down, I’ll take my win. Overall though, the forecast is the same as last week, half unsure and half short because there’s no clear PA indication aside from the candle stick pattern.
Until next week, Good Luck Trading!
Brian