
Hello Everyone!
Sorry for the delay, I had a family emergency this morning. Just finished dealing with it now, so here’s this week’s FX Weekly Analysis. Overall, I’m pretty happy about last week, I especially like the projected directionality that I drew last week, they all pretty much went in the direction of the forecast (i.e., the conditions never came into play). This week may or may not be as simple because we’re coming up on “crosses” of trendlines and S/R lines. These crosses are kind of like breaking points (assuming I drew them right) because they’re the blend of both up and downward trendlines and whichever line is stronger determines the directionality. Anyways, enough of that, onto the analysis!
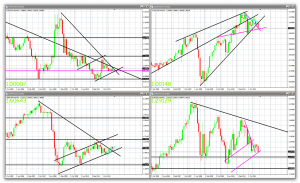
Monthly Charts
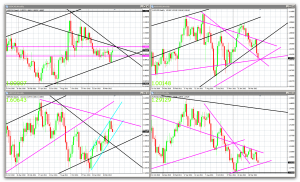
Weekly Charts
Daily Charts
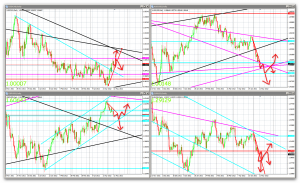
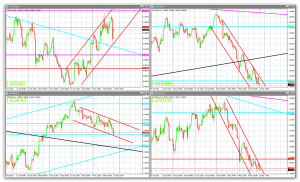
H4 Charts
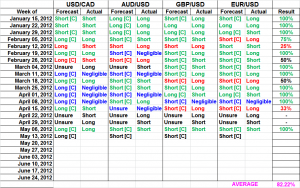
Commentary / Technical Forecasts:
USD/CAD [Long (C)]: The daily downward trendline stretching back to late November 2011 was broken this week. Question is what will happen at the monthly downward trendlines coming up soon. There are two of them, 1 from 2005 and 1 from 2009. Lately, price has been paying attention to the 2009 line more, which is also the first line that price will hit when it gets there. These are the upcoming conditions in play along with the weekly resistance coming up as well since we haven’t broken out of this consolidation range in a long time. Otherwise, breaking the daily trendline should provide plenty of momentum for more upward action. Also, we’ve been consolidating on the way up (with the help of news), so that’s definitely healthy as well, it’s not just consecutive color candles like the other pairs.
AUD/USD [Short (C)]: Since this already broke the monthly trendline last week, this week was projected to keep going down to meet the daily support levels below or weekly trendlines. This happened and based on Friday’s close, both the daily support and weekly trendline have been broken. The conditions in play for more downward movement are based on the multiple weekly trendlines in play and the lower daily supports. But given the monthly trendline was broken last week, with this continued move downwards, this represents a lot of downward momentum. There’s a big cross of weekly trendlines coming up, 1 downward and 2 upward trendlines are about to cross. This might totally be ignored like it was on USD/CAD’s chart or it’ll be used as an indicator for more downward pressure to come.
EUR/USD [Short (C)]: After bouncing off the daily trendline last week, I projected it would go down to the H4 support to bounce or break. This week it ends up breaking the support finally and thus, the break down of the descending triangle has begun! Plus there’s the overall daily downward channel in play as well, so this was eventually going to drop down anyways unless the daily channel broke which it didn’t. Aside from this, if you look on the weekly chart, there’s a weekly trendline coming up (check May 5th, 2012 FX Weekly Analysis for the details of why this line was drawn). I didn’t show it on the H4 chart but it’s coming up shortly, this is the condition in play here because if this is broken, the only big support coming up is monthly support level of 1.2600. Breaking this weekly trendline would be huge because it means more downward pressure to come and since EUR/USD is the leading FX pair, it’s movement will be correlated with the other pairs as well.
GBP/USD [Short (C)]: After drawing the daily trendline last week, I projected consolidation as my forecast because it just has to happen in order to be a healthy run. This happened, it did go down this week but not by much, there’s still plenty of room to go until it reaches the daily upward trendline. The question is what happens at the daily trendline? Will this follow EUR/USD on the way down and break the trendline or will the trendline hold and this continues to move upwards. It already broke the monthly trendline a month ago, so there’s plenty of upward momentum for this to continue upwards but the bigger picture revolves around the Euro Zone which I don’t follow lol, since I don’t read news. In the event the daily trendline breaks, there’s daily support on the way down plus the monthly trendline. Since the monthly trendline acted as resistance before and broke, it should become support down if price goes back towards it. Whether or that the goes thru is left for the coming weeks to forecasts….
Until next week, Good Luck Trading!
Brian